Management
●
August 25, 2025
●
8 min reading
Meeting KPIs You Should Track
Most teams meet too often, too long, and without clear outcomes.
That’s where meeting KPIs come in.
In this guide, you’ll discover the 10 best meeting KPIs to track.
10 Best Meeting KPIs
Tracking meeting KPIs gives you a clear picture of whether your meetings help or hurt your team. Each KPI highlights a different part of meeting health. When combined, they tell you if your time together is efficient, engaging, and valuable.
1. Attendance Rate
What it is
Attendance rate shows how many invited participants actually show up. Low attendance usually means the meeting feels irrelevant or poorly timed.
How to calculate
(Number of attendees ÷ Number of invitees) × 100
Good example
10 people invited, 9 attend → 90%. Strong relevance and buy-in.
Bad example
12 invited, 5 attend → 42%. Most skipped, suggesting it wasn’t worth their time.
2. Agenda Usage
What it is
This tracks how many of your meetings include and follow a written agenda. Agendas make discussions sharper and more productive.
How to calculate
(Number of meetings with an agenda ÷ Total meetings) × 100
Good example
9 out of 10 meetings had clear agendas → 90%. Teams stayed focused.
Bad example
Only 2 of 10 meetings used agendas → 20%. Conversations wandered with no clear end.
3. Time Planned vs Time Spent
What it is
Shows how well you stick to the scheduled duration. Running over wastes time; finishing too early often means poor planning.
How to calculate
(Actual meeting duration ÷ Planned duration) × 100
Good example
Planned 60 minutes, ended in 58 → 97%. Agenda matched reality.
Bad example
Planned 30 minutes, ran 55 → 183%. Signals poor control.
4. Start and End Punctuality
What it is
Measures how often meetings start and finish on time. Respecting schedules builds trust.
How to calculate
(Number of meetings that started and ended on time ÷ Total meetings) × 100
Good example
18 of 20 meetings last month began on time → 90%. Reliable culture.
Bad example
Only 5 of 20 began on time → 25%. Frequent delays cause frustration.
5. Participation / Engagement
What it is
Tracks how many people contribute actively. More voices mean stronger collaboration and decisions.
How to calculate
(Number of participants who spoke or contributed ÷ Total attendees) × 100
Good example
8 out of 10 people spoke in a brainstorming session → 80%. Healthy interaction.
Bad example
12 in the room, only 2 spoke → 17%. Passive, wasted potential.
6. Action Items Created
What it is
Counts the number of tasks assigned during a meeting. A meeting without tasks is just talk.
How to calculate
Simply count how many tasks were assigned, with clear owners and deadlines.
Good example
Marketing sync ends with 5 tasks assigned. Everyone leaves knowing what to do.
Bad example
One-hour meeting ends with zero tasks. Nothing changes afterward.
7. Action Item Completion Rate
What it is
Shows whether tasks agreed in meetings actually get done. It links meetings directly to results.
How to calculate
(Number of completed action items ÷ Total action items) × 100
Good example
10 tasks assigned, 9 completed → 90%. Commitments followed through.
Bad example
12 tasks assigned, only 3 completed → 25%. People ignore commitments.
8. Meeting ROI / Cost per Meeting
What it is
Meetings have a cost. Multiply time spent by attendees’ salaries. ROI tells you if the meeting created enough value to justify that cost.
How to calculate
- Cost = Meeting duration in hours × Number of attendees × Average hourly salary
- ROI = Value generated ÷ Cost
Good example
A client call with 4 people costs $400. It closes a $20,000 deal. ROI is excellent.
Bad example
A weekly update with 12 people costs $1,200. No outcomes, no decisions. ROI is negative.
9. Meeting Length and Frequency
What it is
Shows how often your team meets and for how long. Too many or too lengthy meetings cut into real work.
How to calculate
Average meetings per person per week, and average length per meeting.
Good example
Team members average 4 meetings per week, 30 minutes each. Balanced.
Bad example
Team members average 15 meetings per week, 60 minutes each. That’s 15 hours—too heavy.
10. Outcome Clarity (Decisions Made)
What it is
Tracks how often meetings end with clear outcomes: decisions, agreements, or next steps. Without clarity, meetings feel wasted.
How to calculate
(Number of meetings with at least one documented decision ÷ Total meetings) × 100
Good example
9 out of 10 meetings ended with clear decisions → 90%. Everyone knows what’s next.
Bad example
Only 3 of 12 meetings ended with decisions → 25%. People leave confused.
How to Track All These KPIs

You now know which meeting KPIs matter. The next step? Tracking them consistently and effortlessly. Here’s how to put systems in place—whether you’re using simple tools or powered-up analytics.
1. Choose the right tools
Meeting analytics platforms can automatically capture key data. Tools like Flowtrace connect to your calendars and video-conference apps to gather metrics such as meeting frequency, duration, attendance patterns, costs, and engagement trends across platforms like Google Calendar, Outlook, Zoom, and Teams. That gives you dashboards you can actually act on.
Other solutions like nTask, ClickMeeting, Zoom, or HubSpot Meetings offer tracking features, reminders, agenda storage, and analytics for attendance and engagement.
2. Let your tools do the heavy lifting
Once set up, these tools:
- Track attendance rates and who joins late—
- Compare planned agendas with actual time used
- Record meeting lengths, frequencies, and costs
- Visualize which team members are overloaded with meetings
This frees you from manual input—and gives you clean, repeatable data.
3. Use simpler methods if needed
If you don’t have full analytics software, you can still track KPIs effectively:
- Use a shared spreadsheet or meeting audit template.
- After each meeting, log attendance rate, start/end times, tasks created, and tasks completed.
- Add columns for ROI or outcome clarity, even if you assign ballpark values.
- Review weekly or monthly to spot trends.
4. Set clear benchmarks
With your tracking in place, define what counts as “good.” For example:
- Aim for over 90% attendance.
- Use an agenda in at least 80% of meetings.
- Action completion above 80%.
- Meeting duration that matches plan within ±10%.
- Fewer than 2 hours per person per day in meetings.
Over time, update benchmarks based on team norms and feedback.
5. Involve your team
Sharing the right KPIs helps build better meeting habits:
- Explain which metrics you're tracking and why.
- Encourage meeting owners to aim for those KPIs (e.g., always have an agenda; assign action items).
- Use team dashboards or quick check-ins to celebrate wins—or tweak what isn’t working.
6. Act on insights
Here’s what you can do with the data:
- If attendance is low, revisit meeting purpose or timing.
- If meetings go long, tighten agendas and enforce time limits.
- If tasks are getting missed, simplify action tracking or assign clearer owners.
- If people are overloaded, redesign recurring meetings or block focus time.
Flowtrace users often recover 2–3 hours per week per person by standardizing agendas and reducing unnecessary meetings.
Meeting KPIs and Data in One Place : Noota
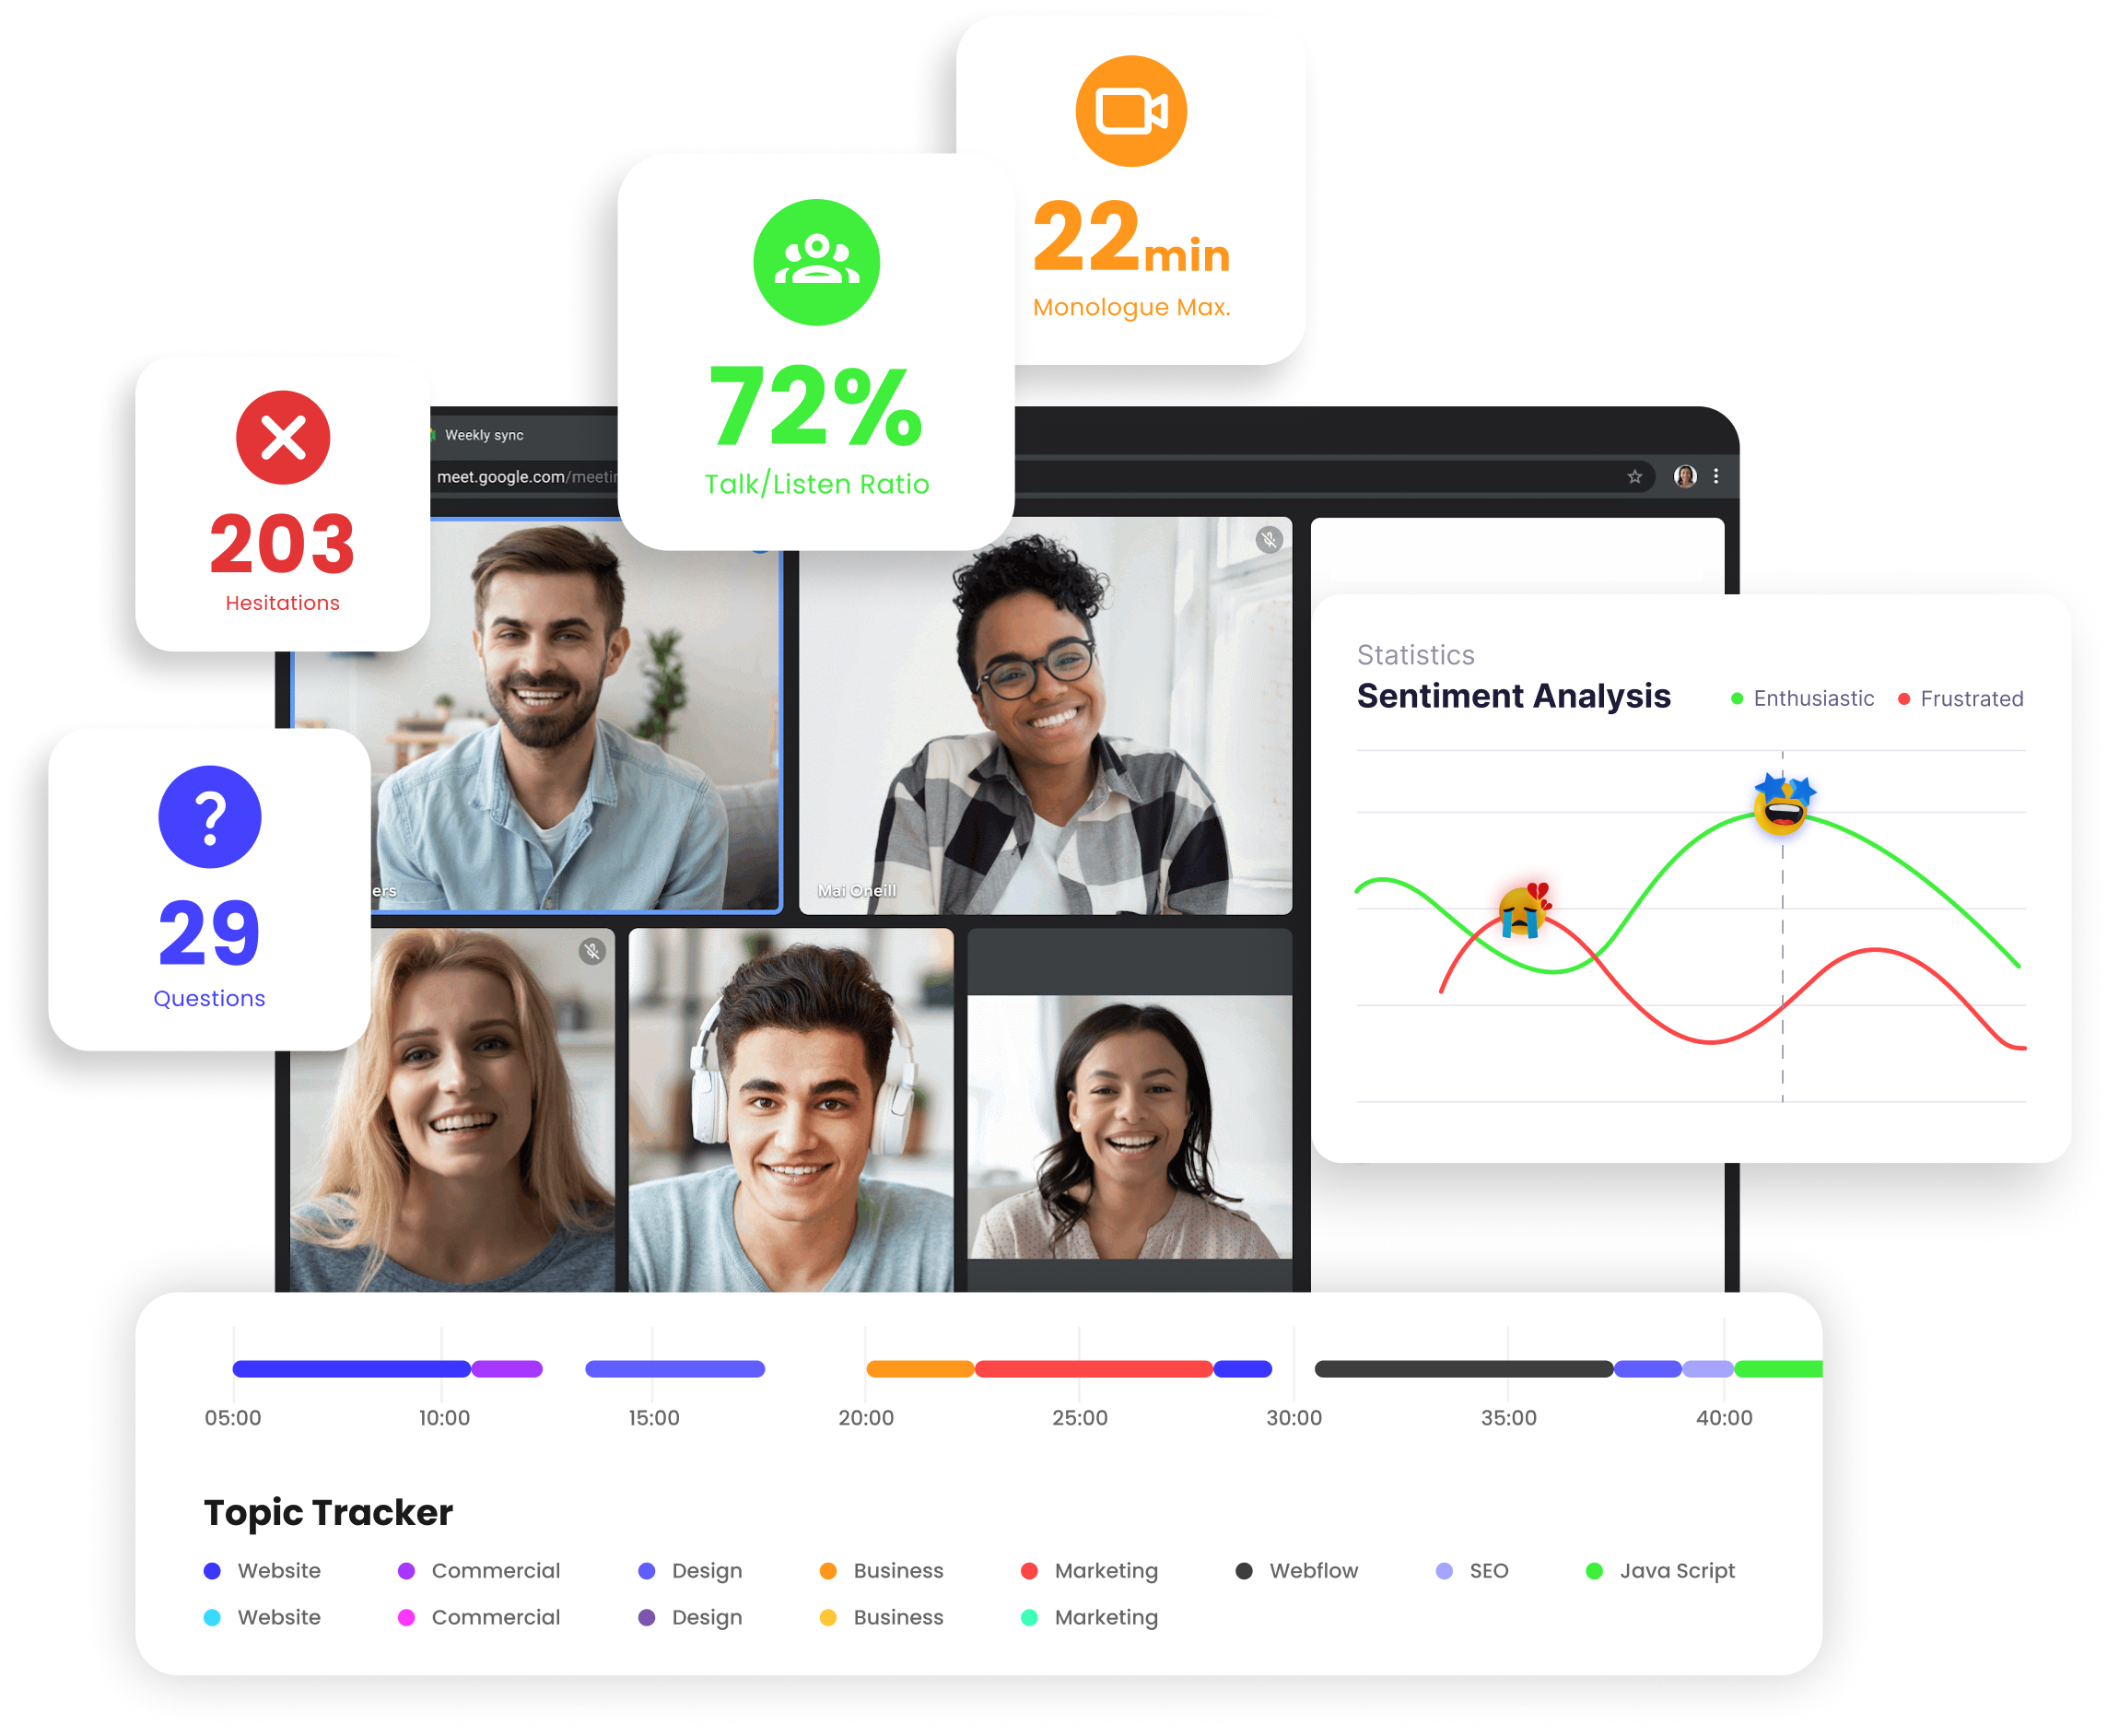
You deserve a meeting KPI system that doesn’t add extra work. Noota captures metric-rich meeting data—and packages it automatically in one dashboard : *
- Speaking time analysis
Noota shows you the speaking ratio in every meeting. You can see if one person dominates or if participation is balanced. For KPIs like engagement and participation, this data is priceless. - Topic detection
Noota identifies when key topics are discussed. If you set guidelines or agenda points, it highlights exactly when they came up. This helps you measure agenda usage and outcome clarity automatically. - Sentiment tracking
Beyond words, Noota reads the tone of conversations. It flags positivity, frustration, or tension. That tells you whether your meetings are energizing—or draining—your team. - Action detection
When someone says “I’ll handle that” or “Deadline is Friday,” Noota captures it as an action item. No need to rely on memory. This ensures KPIs like “action items created” and “completion rate” are always visible.
Also Noota provides notes & follow up for each of your meeting :
- Auto-join and auto-capture
Noota joins your calls automatically via Zoom, Teams, or Google Meet. It records your meetings, transcribes them live, and never misses a word—so you stay present while data gets collected. - Instant summaries and action items
When the meeting ends, Noota delivers a clean, structured recap: key takeaways, decisions, and action items—without you lifting a finger.
That means KPIs like “action items created” and “decisions made” are logged automatically. - Guidelines tracking
You can set topics or questions in advance—Noota flags them during the meeting and highlights when they were addressed. That boosts agenda usage and outcome clarity. - Action-powered AI agent
Noota goes beyond summaries. Its AI agent can act on your behalf—sending emails, updating systems, or logging tasks—all triggered by specific moments in the meeting. That automates follow-ups and tracking.
You want to track your meeting KPIs easily ? Try Noota for free now.
Meet the Writer
.webp)
Alexandre is the CEO of Noota. He has dedicated his life to helping sales reps and recruiters improve their work processes.
FAQ
What is a good attendance rate for meetings?
A good attendance rate is 80% or higher — anything below signals irrelevance or poor timing.
- 90% attendance shows strong buy-in and relevance
- Below 50% means the meeting wasn't worth attendees' time
- Track over time to spot patterns in specific meeting types
How do you measure meeting participation effectively?
Divide the number of people who spoke by total attendees, then multiply by 100.
- 80% participation indicates healthy collaboration and engagement
- Below 20% means passive attendance and wasted potential
- Best AI notetakers track speaker time automatically per participant
How does Noota help track meeting KPIs better than manual methods?
Noota automates KPI tracking with zero manual work — capturing attendance, action items, and participation in every meeting.
- AI action items auto-extract tasks with owners and deadlines
- Meeting transcription software tracks who spoke and for how long
- Saves 6.4 hours per week per team member on admin work
Why do most meetings fail to create action items?
Meetings without clear agendas or note-takers rarely produce actionable tasks — discussions end with no accountability.
- Only 20% agenda usage means conversations wander without outcomes
- Manual note-taking misses 40% of action items in fast discussions
- Automatic meeting notes capture every task with context and deadlines
Which tool is best for tracking meeting KPIs automatically?
Noota is the best AI meeting assistant for tracking KPIs — it auto-captures action items, participation, and meeting outcomes with 95% accuracy.
- AI meeting summary tool generates KPI reports after every call
- Reduces administrative work by 80% across 5,000+ enterprise teams
- Works as a bot-free AI notetaker with CRM sync and searchable knowledge hub
Try Noota free — no credit card needed.