8 Best ATS Reports & Metrics to Look At

Leverage your Interview Data
AI interview notes, scorecard, follow-up, ATS integration, and more...
.svg)
.svg)
Your ATS is full of data.
But chances are, you’re only looking at a small part of it.
In this article, you’ll discover the most important ATS reports to check.
1. Time to Fill vs. Time to Hire
Time to Fill measures how long it takes your company to fill an open position from the moment the job is approved or posted until the candidate accepts the offer.
Tracking this report in your ATS helps you answer questions like:
- Are roles taking too long to fill compared with industry benchmarks?
- Is your sourcing strategy working fast enough?
- Are internal approvals or bottlenecks slowing you down?
If your ATS shows that time to fill is growing over time, that might signal a need to streamline sourcing, speed up screening, or tighten decision workflows.
2. Interview ATS Report with Noota
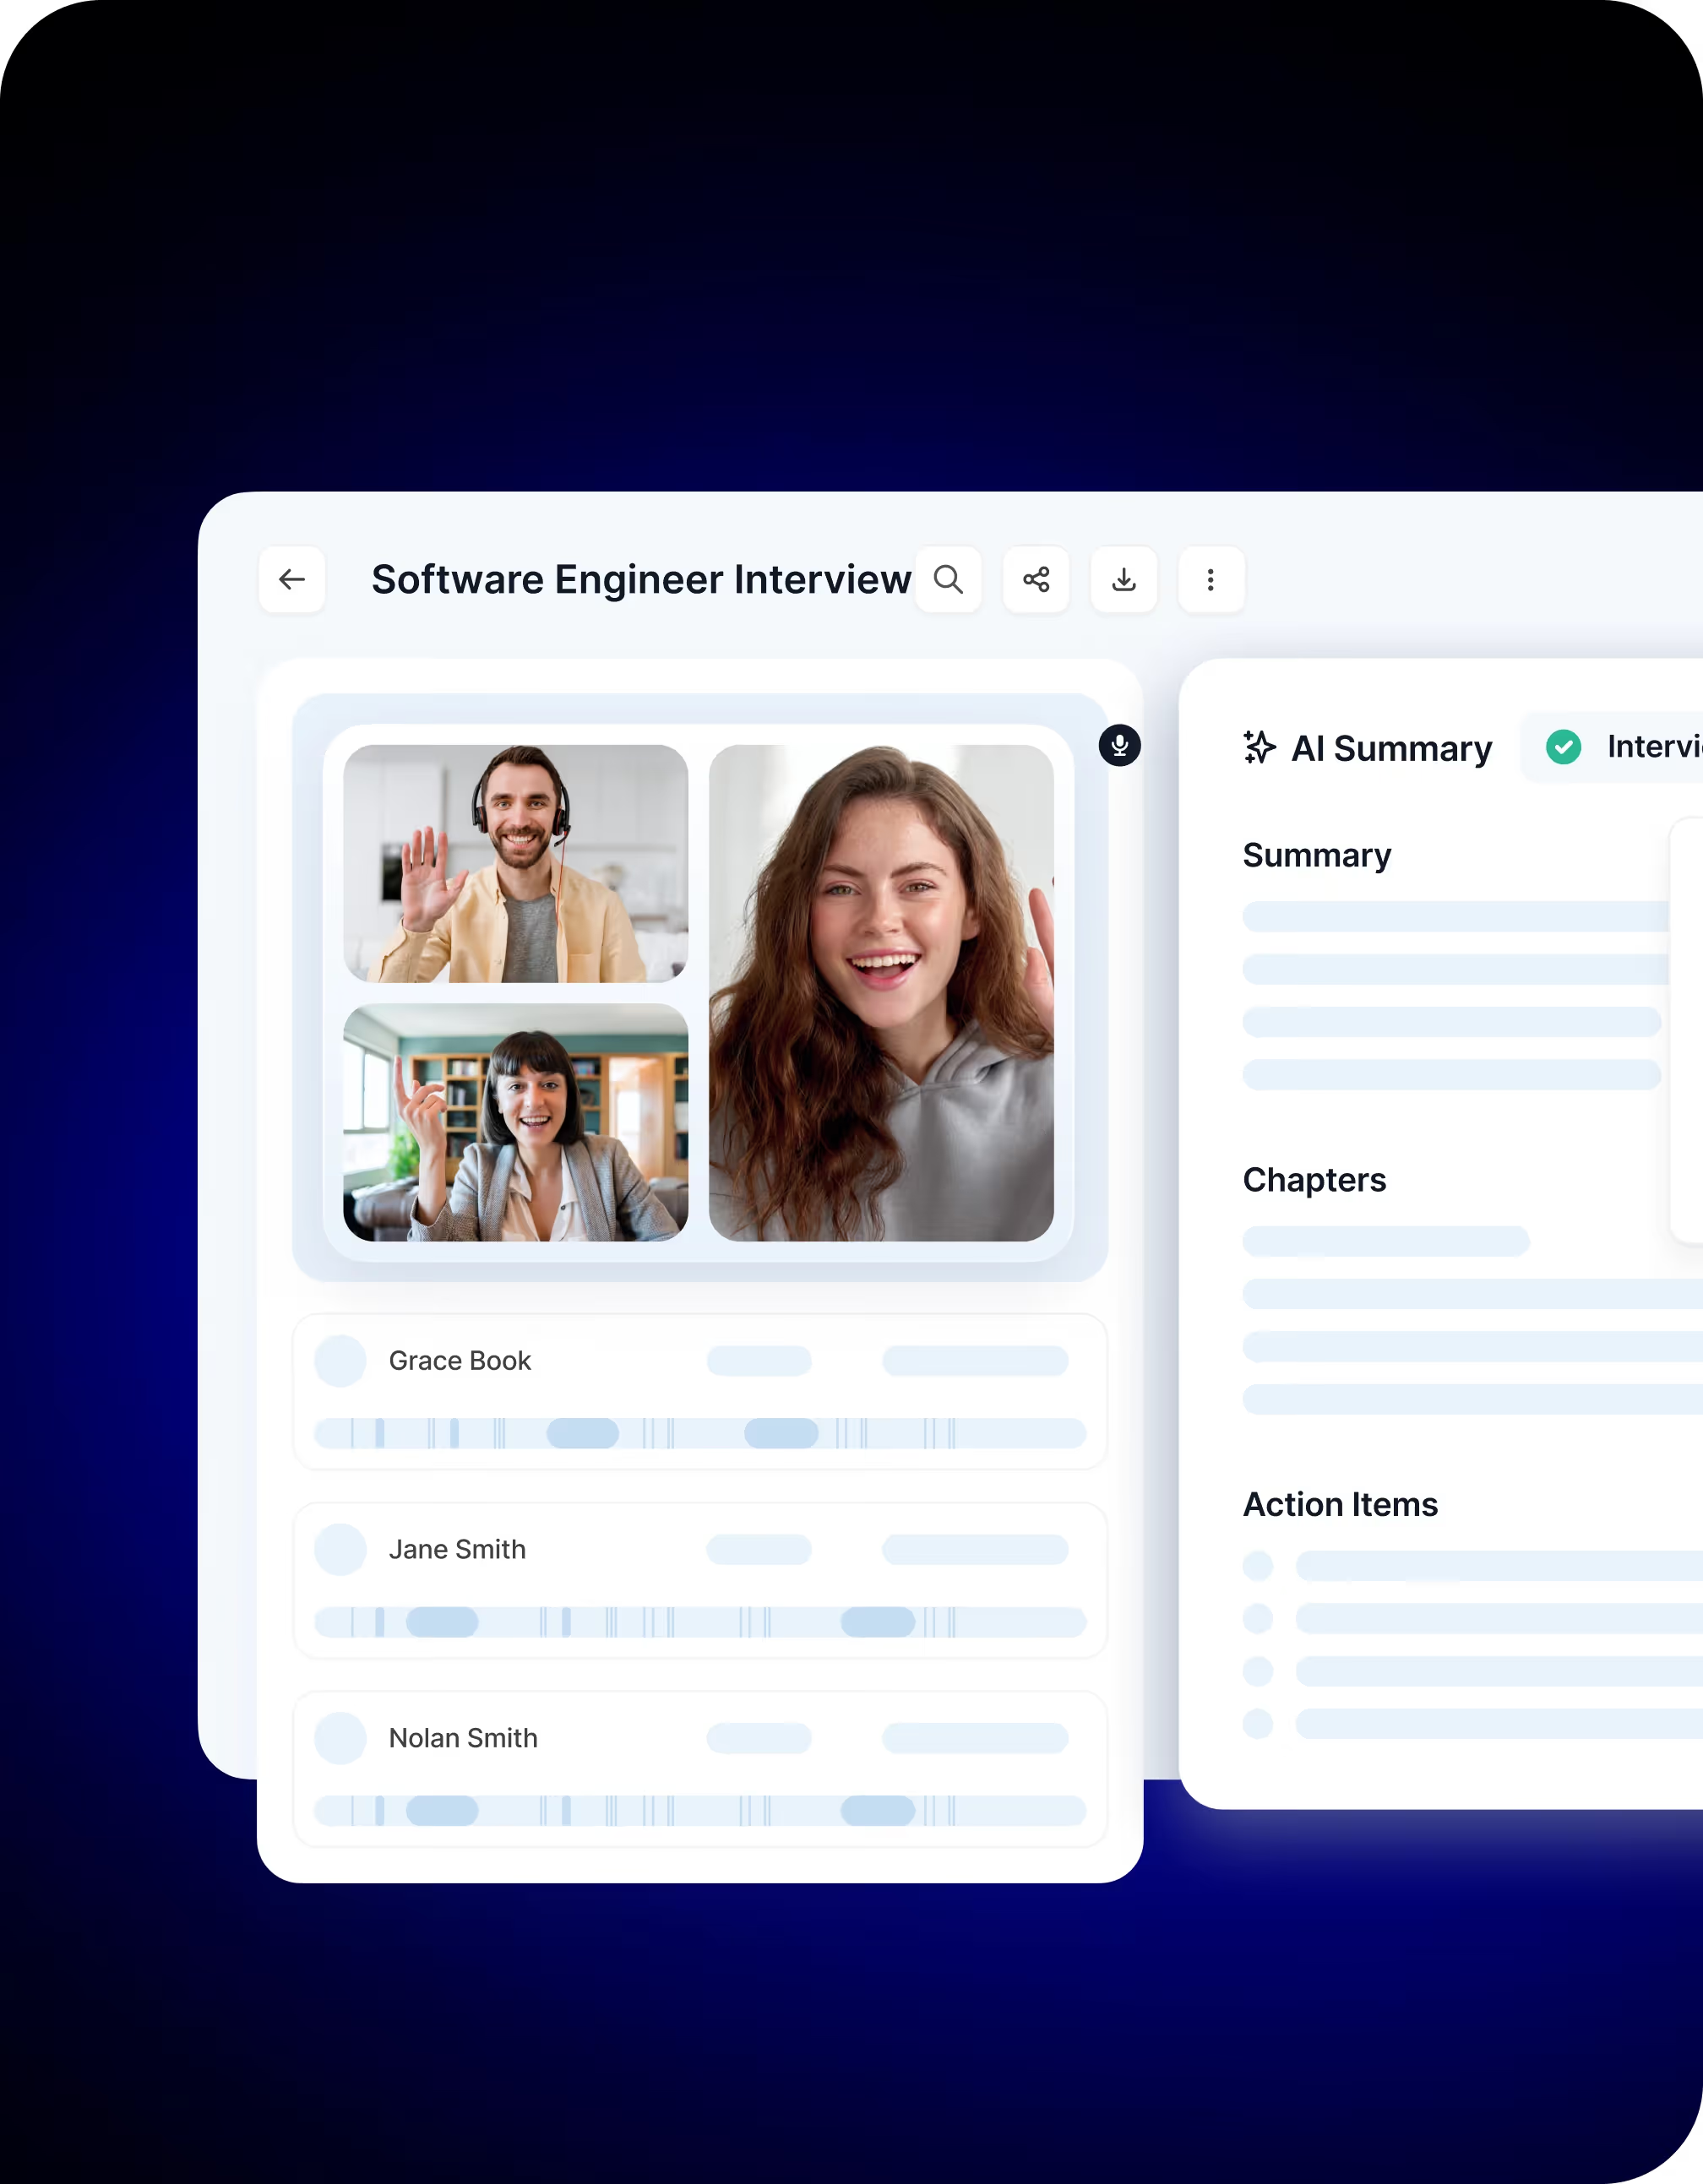
Noota enhances your ATS with deep interview analytics you can’t get from simple status changes alone.
• Structured Interview Notes and Summaries
Every interview — online, in person, or by phone — is recorded, transcribed, and summarized.
Noota turns raw audio into organized notes highlighting key answers, action items, and evaluation points that matter for hiring decisions.
• Evaluation Grids and Scorecards
Instead of scattered feedback, Noota can automatically fill in standardized scorecards based on criteria you define (such as skills, communication, cultural fit). That means every candidate gets assessed under the same framework — no guesswork, no bias.
• Key Metrics from All Interviews
Your ATS report can now show things like average interview ratings, conversion rates from interview to offer, and even interview-to-hire ratio — metrics that help you judge interview efficiency and quality. For example, an interview-to-hire ratio helps you see how many conversations it takes to make a hire, so you can refine screening or questioning over time.
• Conversation Intelligence Trends
Beyond scoring, Noota captures insights into how the conversation flows — such as who speaks most, how answers align with expectations, or which topics surface most frequently. These patterns help you understand candidate strengths and interview effectiveness at scale.
TRY NOOTA FOR FREE HERE
3. Source of Hire / Channel Effectiveness
The Source of Hire report breaks down your hires by the source that brought them in — job boards, your careers page, employee referrals, social media, recruitment agencies, or other channels. What makes this metric valuable is that it focuses on successful hires, not just where candidates first appeared in your pipeline.
Instead of guessing which channels are effective, this report lets you see the actual impact of each source on your hiring outcomes.
Channel Effectiveness
Most modern ATS platforms go beyond raw source counts and include channel effectiveness metrics. These show you not only where candidates come from, but how well each channel converts talent into hires.
4. Funnel & Conversion Reports
A funnel or pipeline conversion report breaks your recruiting process into stages — for example: Applied → Screened → Interviewed → Offered → Hired.
Your ATS visualizes this as a funnel, with the number of candidates shrinking at each stage. That visual makes it easy to see where most candidates are dropping out, so you can focus your improvement efforts on the steps that need it most.
Key conversion metrics to track
- Stage-to-stage conversion rates: This tells you what percentage of candidates move from one step to the next — e.g., application to screening, screening to interview, interview to offer. Falling numbers here tell you which transition points need optimization.
- Drop-off rates: These show where candidates exit the funnel prematurely. High drop-off at a specific stage usually indicates a process pain point — like too many screening questions or long waits for interview invites.
- Overall funnel conversion: This is the big picture — the percentage of initial applicants who end up hired. Comparing this number across roles or time periods shows you where throughput is strongest or weakest.
5. Cost-Per-Hire & Recruitment Spend Analytics
Cost per hire measures the total cost your company incurs to fill a position — not just salary, but every recruiting expense along the way.
In practical terms, this includes internal costs (your recruiters’ time, hiring manager involvement, referral bonuses, ATS subscriptions) and external costs (job board fees, agency fees, advertising, candidate travel or relocation incentives). You calculate it by adding all those expenses and dividing by the number of hires in a defined period.
6. Quality of Hire & Early Attrition
Quality of hire is a metric that evaluates the value your new employees bring to the team after they start.
It looks at how well hires perform, how quickly they ramp up, and how well they fit into your organization’s goals and culture.
A high quality of hire usually means better productivity, smoother onboarding, and stronger long-term outcomes
How ATS helps you measure quality of hire
Your ATS can track a variety of signals to help quantify this metric, including:
- Performance indicators from your HR data (like manager ratings or goal completion).
- Retention data — whether a new hire stays beyond a critical period (typically 6 or 12 months).
- Time to productivity, showing how quickly new hires reach expected performance levels.
- Early attrition, which captures those who leave soon after starting.
7. Candidate Activity & Engagement Reports
Modern ATS platforms track candidate activity and engagement metrics, giving you a window into how actively candidates interact with your job postings, communications, and screening steps. That helps you spot friction points and improve experience across the board.
Examples of key engagement metrics in your ATS
- Email open and reply rates: See how candidates respond to outreach.
- Application completion rate: Tracks drop-offs during form filling or screening steps.
- Interview attendance rate: Reveals how often scheduled interviews actually happen.
- Offer acceptance rate: Tells you whether candidates love your offers or walk away.
- Candidate NPS: Measures overall satisfaction with your recruitment experience.
8. Offer Acceptance & Interview Outcome Reports
The offer acceptance rate is one of the simplest yet most powerful reports your ATS can produce. It shows the percentage of candidates who accept your offers compared with the total number of offers extended. A high acceptance rate usually means your job proposition — including role clarity, compensation, and employer brand — resonates with the talent you pursue. Conversely, a low acceptance rate alerts you to gaps in expectations, communication, or competitiveness in the market.
This report matters because it touches the final and most impactful step of the hiring funnel — whether a candidate says “yes” or walks away.
Leverage your Interview Data
AI interview notes, scorecard, follow-up, ATS integration, and more...

Jean-marc is an AI expert helping recruiters & professionnals leverage these tools in their everyday work.
Related articles
.webp)

.png)


Forget note-taking and
try Noota now
FAQ
In the first case, you can directly activate recording as soon as you join a videoconference.
In the second case, you can add a bot to your videoconference, which will record everything.
Noota also enables you to translate your files into over 30 languages.
.svg)